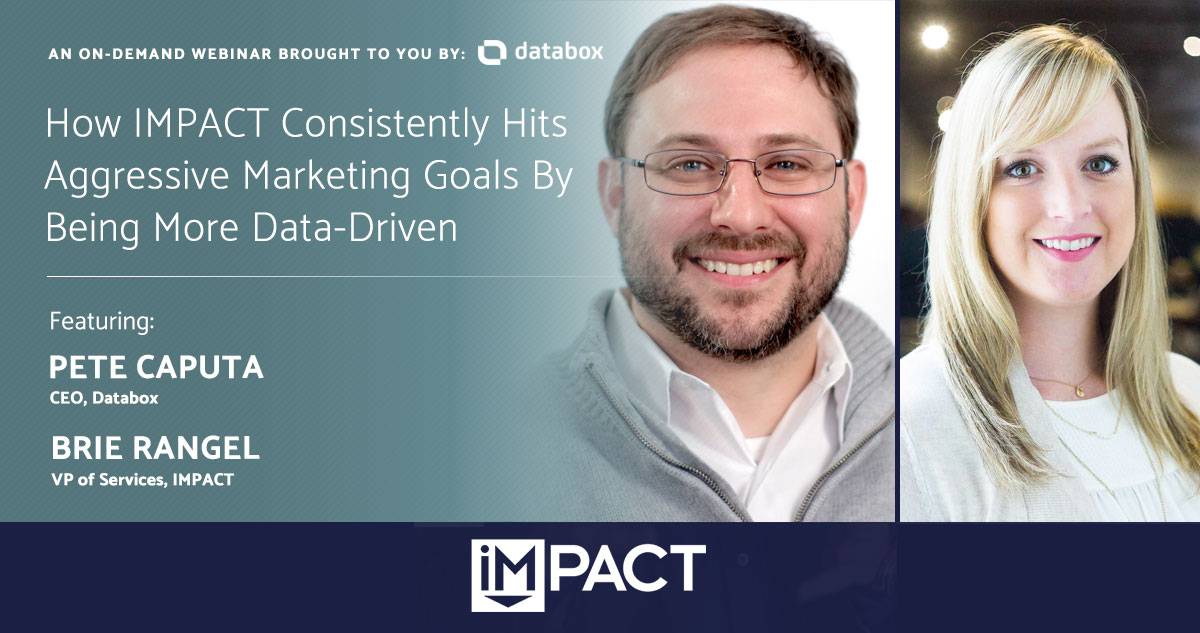
On-Demand Webinar
Feeling stuck on how to improve your website? We've got you! Get a FREE, live website critique from our experts.
Feeling stuck on how to improve your website? Get a FREE, live website critique from our experts.
-
Services
-
They Ask, You Answer Mastery
They Ask, You Answer MasteryA coaching & training program that drives unmatched sales & marketing results.
-
Sales Performance Mastery
Sales Performance MasteryImprove the competencies and close rates of your sales organization.
-
Website Mastery
Website MasteryWeb design, development & training for your team.
-
HubSpot Mastery
HubSpot MasteryEverything you need to get the most from HubSpot.
-
AI Enablement Mastery
AI Enablement MasteryUnlock the power of AI in all aspects of your revenue operations.
-
More Services
-
Discover how IMPACT’s services can help take your business to the next level.
Book a free 30-minute coaching session
-
They Ask, You Answer Mastery
- Success Stories
- Pricing
-
Community
-
IMPACT LIVE is coming to Chicago in 2024!
Get Event Details Here
-
IMPACT LIVE is coming to Chicago in 2024!
Get Event Details Here
-
Learning Center
-
Learning Center
Learning CenterFree resources to help you improve the way you market, sell and grow your business.
-
[NEW] The Endless Customers Podcast is now available everywhere. Learn how to earn trust & win more customers in the age of AI.
Listen Now
-
Learning Center
Services
![Gear icon]()
More Services
Discover how IMPACT’s services can help take your business to the next level.
Book a free 30-minute coaching session
/Assets/base/Navigation%20Icons/navigation%20arrow%20-%20facing%20right-01.svg)
Community
IMPACT LIVE is coming to Chicago in 2024!
Get Event Details Here
/Assets/base/Navigation%20Icons/navigation%20arrow%20-%20facing%20right-01.svg)
Learning Center
[NEW] The Endless Customers Podcast is now available everywhere. Learn how to earn trust & win more customers in the age of AI.
Listen Now
/Assets/base/Navigation%20Icons/navigation%20arrow%20-%20facing%20right-01.svg)


