/Assets/base/Navigation%20Icons/TAYA.svg)
/Assets/base/Navigation%20Icons/Sales.svg)
/Assets/base/Navigation%20Icons/Web%20design.svg)
/Assets/base/Navigation%20Icons/HubSpot.svg)
/Assets/Icon%20Library/AI%20Mastery.svg)
/Assets/Icon%20Library/Learning%20Center%20Laptop.svg)

Apr 6, 2017
/Assets/Icon%20Library/x%20corp.svg)
/Assets/Icon%20Library/whatsapp%20logo.svg)
/Assets/Icon%20Library/Email.svg)

For the most part, most marketing leaders in today’s world are going to have some kind of revenue or customer goal that ties back to its great business goals.
One level deeper, they’ll be an even more specific goal for a certain number of sales qualified leads, but without looking at every single one, suffice to say most marketing leaders are going to have a traffic goal and a conversion goal.
There are hundreds of tools available to today’s modern digital marketer, but there are two that stand out above the rest when it comes to reaching these goals and providing priceless information from your actual users:
Hotjar, and Google Search Console.
Here’s why I never improve a website without them.
My Recommended Approach to Improving a Website
When making any changes to a website - whether it’s layout, imagery, content, or the flow from page to page, it’s important to always keep improving. Updating your website is like going to the gym - you don’t stop just because you’re in shape.
The two tools I use to stay in this routine are Hotjar and Google Search Console. Here are the key areas to focus if you’ve never used either before, or you want to look at them with a fresh set of eyes.
Hotjar
At the highest level, I use Hotjar to see how people are interacting with the site. I do that using two primary features:
Heatmaps
Heatmaps show you three things for desktop visitors:
- Where on your page visitors are clicking.
- Where on your page visitors are moving their pointers.
- How much of your page is scrolled to by visitors (in aggregate)
For mobile visitors (tablets, phones, everything in between), Hotjar shows you two things:
- Where on your page visitors are tapping.
- How much of your page is scrolled to by visitors (in aggregate).
Here’s a screenshot of what you’ll see at the top of a specific heatmap. This heatmap is for our 6 critical marketing KPIs landing page:
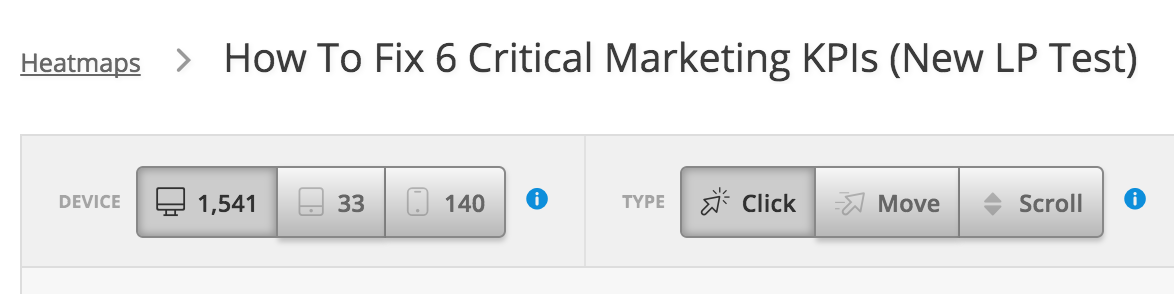
Without even looking at the heatmap itself, this already tells you that about 90% of visitors view this page on desktop.
Google Analytics will tell you the same thing, but this is more useful in the context of the heatmap because you can choose one of each of these filters to view different sets of data. I’ll go into a little more detail in this click map for desktop users:
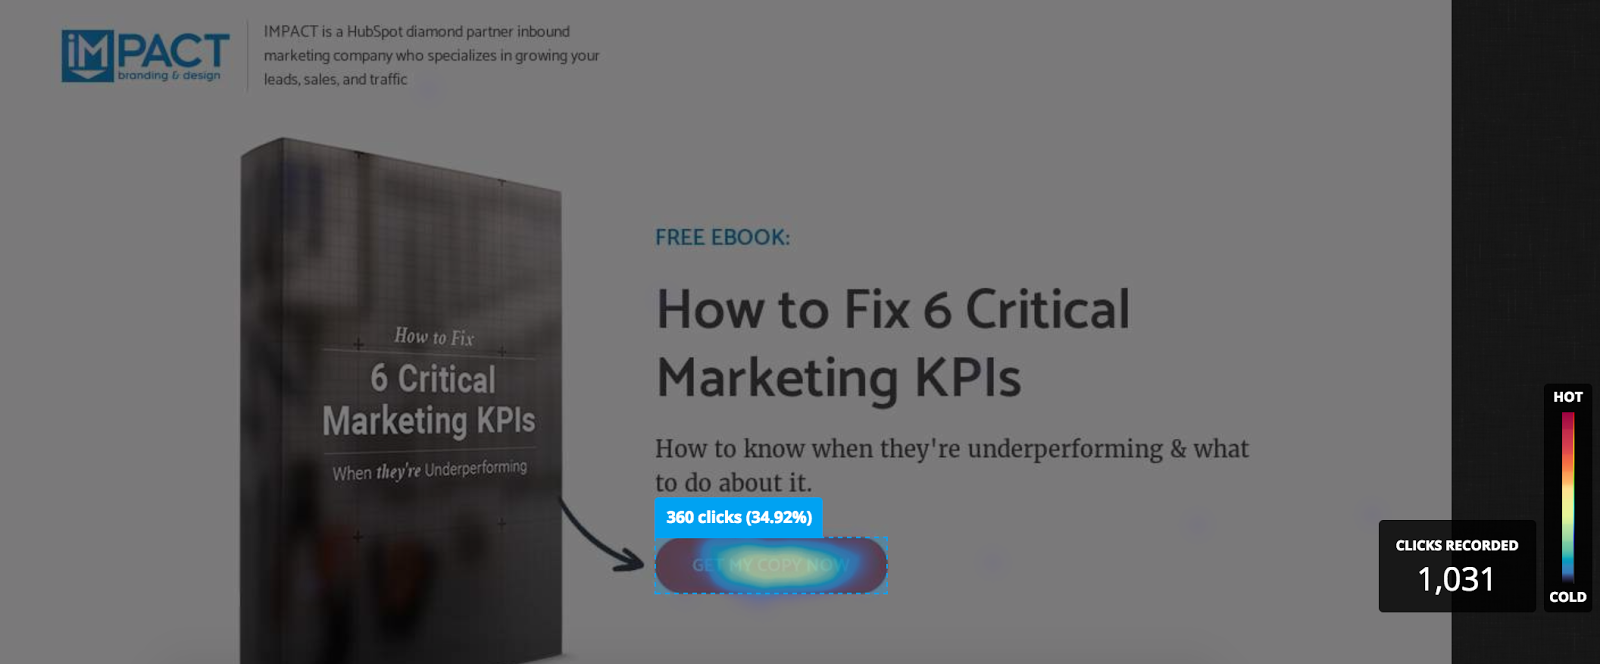
I’ve highlighted the button the page, and as you can see, about 35% of users that get to this page are clicking on the button above the fold. That’s exactly what we want - it’s why we have a button there. I mean, after all, don’t you want to fix your underperforming marketing KPIs?
Note: Hotjar doesn’t just automatically show you this information. Once you set up the page you want to analyze, it will need time to record and track a strong sample. Read this note on sampling from Hotjar, in case you’re curious how the data breaks down.
This is a portion of the heatmap for desktop users, and it shows where they have moved their cursor on the page:

We include a preview section on this landing page (pictured above) so visitors can see what they are getting. It’s kind of like buying books on Amazon - you can preview the book before you buy it.
It’s no surprise that there’s a high concentration of mouse movement in this area, and you can see that some visitors are probably reading the text by moving their pointers along with it.
The last element of a heatmap that is incredibly useful is the scroll map. This one is for desktop users on the page:
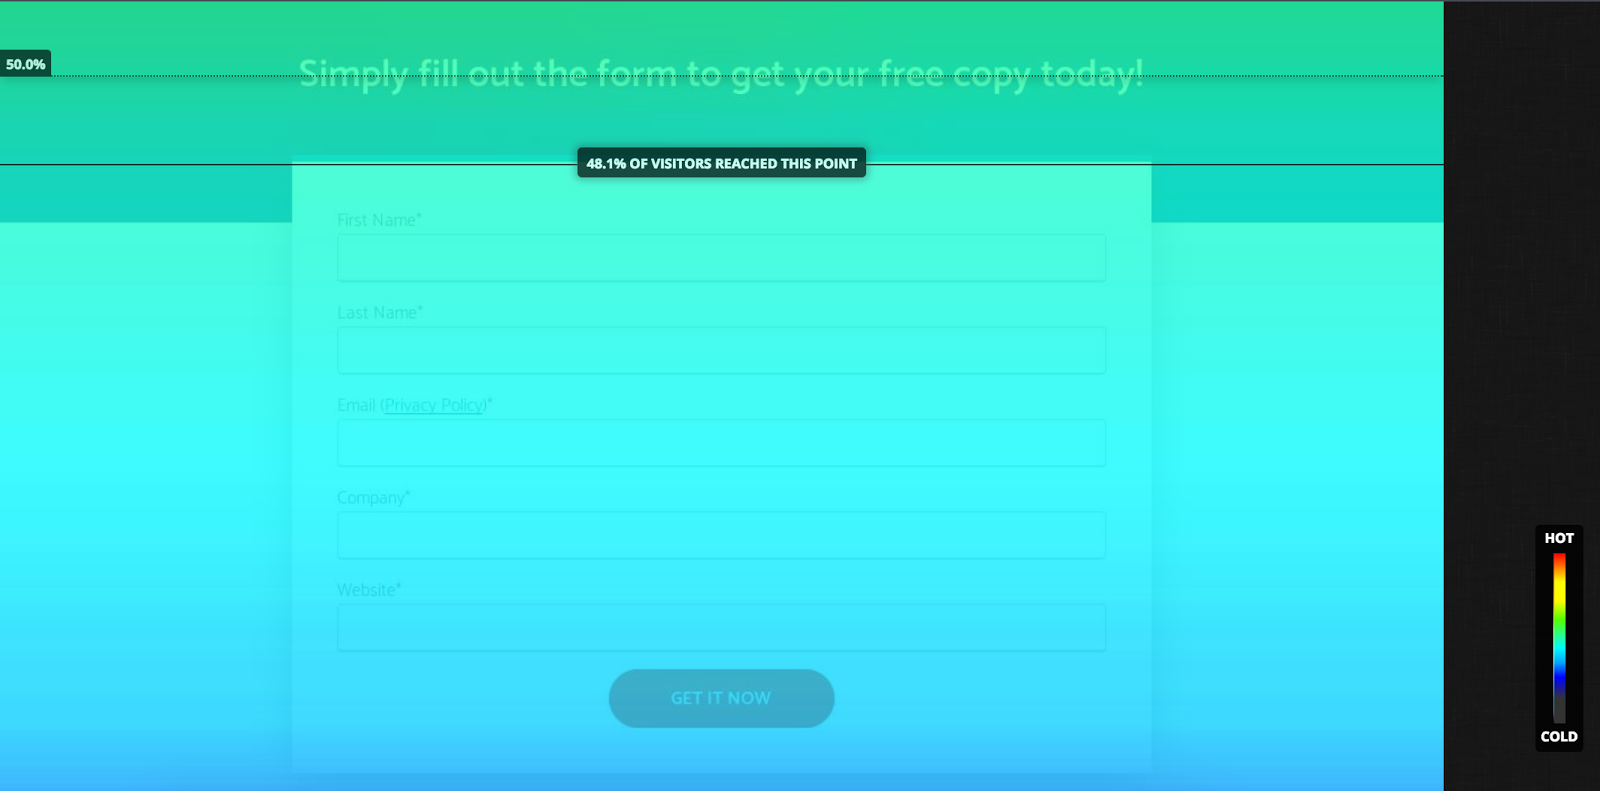
Vertically, it shows you how far visitors are getting down the page -- And THIS IS HUGE.
The goal of landing pages is conversions. If only 25% of visitors reach the portion of the page with a conversion point, it would be a failure, because then only 25% of visitors would even have a chance to convert. By knowing how far people are getting on the page, we can redesign or reformat to make sure the form is delivered earlier.
Now, stop and think about this tool in the context of your own website.
Do you have a highly trafficked page or offer you think could generate more conversions? Put Hotjar on that page, and you can begin to understand what about that page might be reducing its conversion rate.
Think about your homepage and the time and effort you likely put into it. What if you could change one small thing about it, and see a bump in conversions or visits to an inner page?
Hotjar heatmaps can help provide the real user behavior insight you need to get that.
Recordings
Hotjar recordings are just that - recordings of visitors that have visited your website.
Like heatmaps, they’re all anonymized, so you shouldn’t worry about intruding on your visitors, but still, deliver a valuable peek into how people move around your site.
I won’t show you a recording here, but I will explain what insights I am able to gain from recordings:
Engagement with Website Elements
If you have any exit-intent popups on your website, you need to know if people are clicking/ reading, or just totally ignoring them. If you’ve had the same exit-intent for a while, switch things up with a new design, a new layout, or something else entirely to see how they affect performance.
Recordings will give you insight into how specific users react to these popups, and if you watch a few, it’s easy to see a pattern emerge.
This is also true for website pages. Are users clicking on the button you expect them to when you expect them to do it? Are they finding what they want at the top of a page and learning more about it further down, or do they have to hunt for it?
Are they starting forms, but not filling them out entirely? This is a big one, especially on your bottom of the funnel pages and landing pages as a whole. There may be one question that is reducing conversion rates because it adds too much friction.
But recordings can help you know for sure.
How Time Was Spent on a Page
This is NOT time on page, it’s what they did on the page while they were on it.
Google Analytics will tell you the average amount of time users are on a given page, but not what they did there. Hotjar recordings will.
You can answer questions like:
- Did the user read the whole blog post, or just skim it?
- Was there a specific portion of the page that the user spent more time reading?
- Did the user interact with the page the way you thought they would?
Hotjar definitely has other features - in fact, tons of other useful features. If you’re using it already, go to this recently launched resources page to find out how you can use it like a pro. Surveys, polls, and funnels are extremely useful, but for me, they are more contextual and useful only in specific scenarios to gather specific data. Heatmaps and recordings are useful all the time and in every situation, which is why they are my bread and butter.
Hotjar has a free trial for 15 days. Give it a try!
Google Search Console
My other awesome go-to tool is Google Search Console (GSC) (previously Webmaster Tools). Besides giving you the ability to track errors on a domain, submit your sitemap to Google for re-indexing, and a lot of other nifty tools, GSC gives you the ability to see which keywords, when searched in Google, your website shows up in the search results for.
Here’s an example:
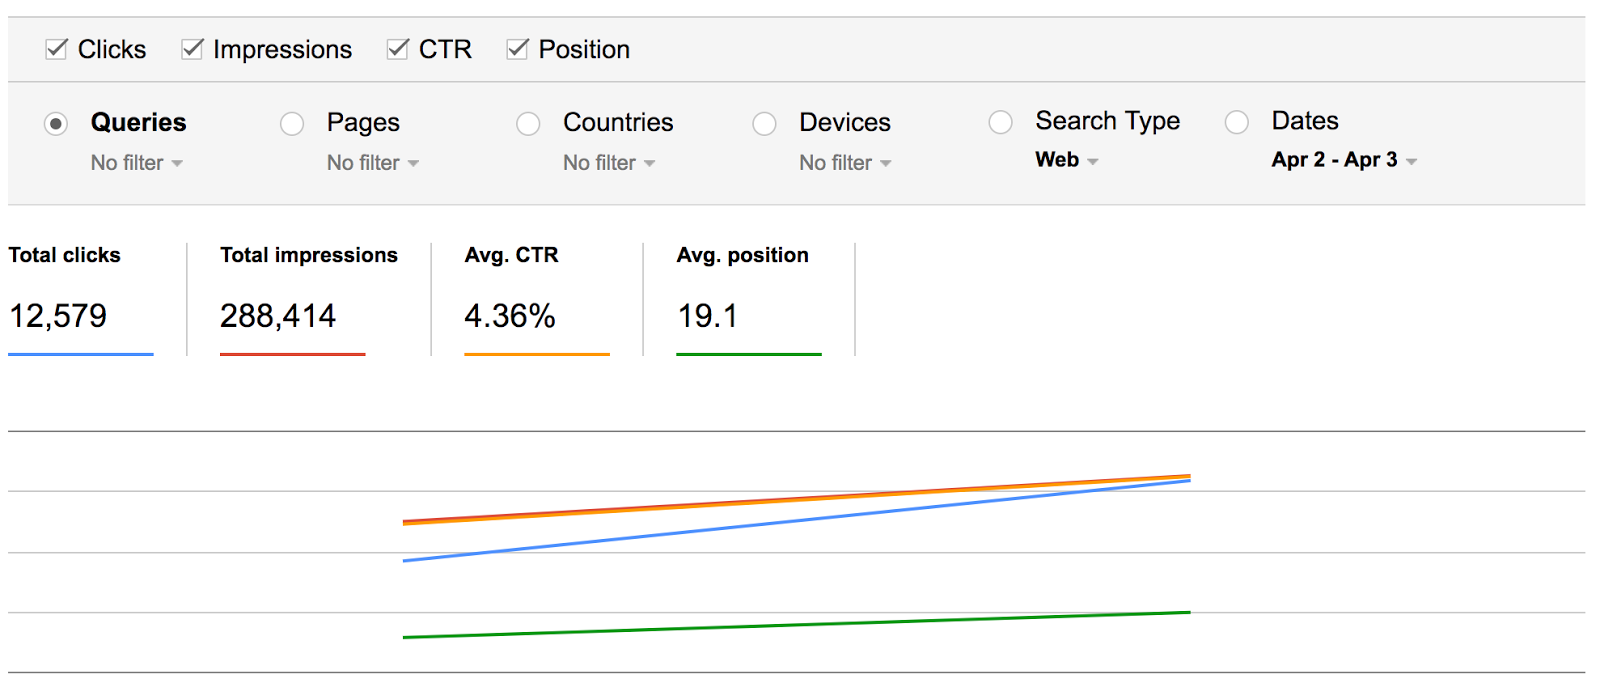
There’s a lot there. You can see:
- Clicks
- Impressions
- Average click through rate
- Average position
All for a given period of time (which you can change). This all updates in real-time as well.
Below this, you’ll see a list of search queries, each with the four metrics:

Google Analytics won’t tell you this. HubSpot won’t tell you this. Persona research will give you an approximation, but nothing as specific as a large set of data can be.
This is the only place that I’ve found that provides this level of detail for specific search queries and is the reason that this is so valuable to marketers like you.
Greater than the Sum of Their Parts: Using Hotjar and GSC Together
While powerful on their own, together, Hotjar and GSC together are even more valuable.
To bring this example home, let’s look at the marketing KPIs blog post.
With GSC, you can do two things which are super helpful here: segment by query string, or segment by page URL -- Or, you can do both.
You can parse the data in many different ways, it’s definitely worth playing around a bit to find the filters or segments that work best for you. Slicing it different ways allows you to see some things you might otherwise miss.
Here, I’ve limited the filters to just queries with ‘kpi’ in them and lead to the URL of the blog post:
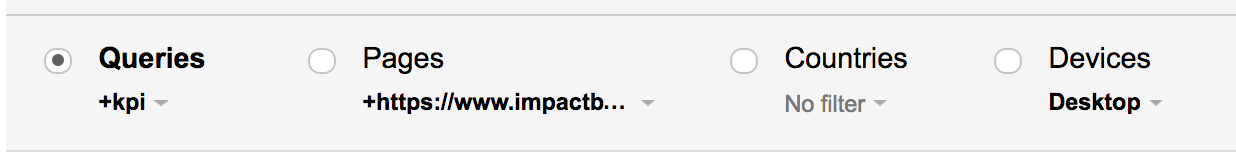
From this easy to setup filter, I gain a list of keywords that have been typed into Google, that have resulted in clicks and impressions to the IMPACT website:

This is the moment when you realize you’ve been doing long-tail keyword research the wrong way. Google Search Console is simply the best keyword tool out there to understand what you have already. There are definitely other tools (usually paid) that can give you insight on keywords, but not with your own data, formatted this well.
Now, heading back to Hotjar’s heatmap of our marketing KPIs blog post and marketing KPIs landing page, we can see exactly what’s going on once the user reaches the page from Google.
Together, these tools give us a complete picture of a user’s journey from search to conversion (or lack thereof) on our website. Tracking this journey, we can see realistically what’s working and what’s not and try to improve the experience and ultimately increase conversions.
tl;dr
Use Google Search Console to understand how your website is ranking for certain keywords with an amazing level of detail, then use Hotjar to understand how your visitors are interacting with that page, and the rest of your site as a whole.
Having gone through this exercise, I now know (in relation to our marketing KPIs blog post and landing page):
- What keywords were used to find the blog post from Google, how many clicks each version of the keyword drove, and each keyword’s CTR from Google’s search engine rankings
- How visitors spent their time on the blog post, and when (or if) they clicked on a link to the landing page
- How much of the blog post they read (approximated, since we aren’t seeing actual users, just their recordings)
- What other pages on the IMPACT site visitors viewed or interacted with before or after this post or landing page
And that’s just for one blog post and landing page. Imagine what this can do for your whole website.
These aren’t trade secrets. There’s nothing that I’ve done here that you can’t do with a couple hours and patience. So, go setup Hotjar and Google Search Console, and give them time to gather data. It’s worth it.
Free: Assessment
/Assets/Icon%20Library/Arrows/Grey%20Arrow%20-%20Prev.svg)
/Assets/Icon%20Library/Arrows/Grey%20Arrow%20-%20Next.svg)