/Assets/base/Navigation%20Icons/TAYA.svg)
/Assets/base/Navigation%20Icons/Sales.svg)
/Assets/base/Navigation%20Icons/Web%20design.svg)
/Assets/base/Navigation%20Icons/HubSpot.svg)
/Assets/Icon%20Library/AI%20Mastery.svg)
/Assets/Icon%20Library/Learning%20Center%20Laptop.svg)

/Assets/Icon%20Library/x%20corp.svg)
/Assets/Icon%20Library/whatsapp%20logo.svg)
/Assets/Icon%20Library/Email.svg)

INBOUND 15, HubSpot's annual conference, was bigger than ever this year and they made several exciting announcements.
If you're already a HubSpot customer, you can check out the full list of product updates here, but the one we're going to discuss in this article is HubSpot's Reporting Add-on.
This new tool allows you to create a central dashboard that combines all of your marketing and sales reports into one interface.
With it, your sales and marketing teams will be able to easily see all of their combined metrics, for a much clearer picture of where they're at in their progress and how they can help each other reach their goals.
The Reporting Add-on is available to all HubSpot users for $200 a month, but you're still undecided, you can start a 30-day free trial to take it for a test drive.
How to Get Your First Reports Dashboard Setup
First, you'll need to go to your Dashboard or Reports home, and click on the link to the Reports Dashboard.
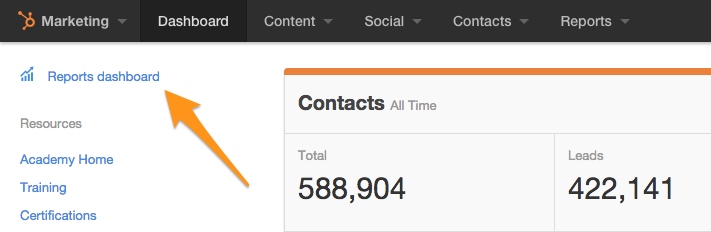
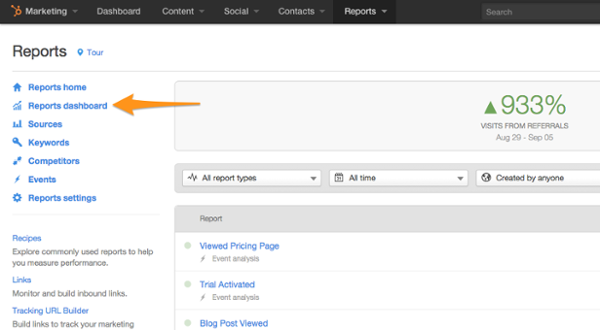
Your "First Dashboard" will already be available and contain a few reports that HubSpot has generated for you.
You can either edit these reports and your dashboard or you can create new reports and a new dashboard.
Simply click the blue "Create new" button and give your new dashboard a name.
What Types of Dashboards Can You Create in HubSpot Reports?
You have the flexibility to create dashboards for a wide variety of purposes. Here are several suggestions you can use:
- You can set up a dashboard that provides a general overview of your marketing and sales for everyone to see.
- You can create a dashboard for each of your buyer personas, that way your information is segmented and you can pinpoint data that's relevant to specific personas.
- You can create separate dashboards for your sales and marketing teams. However, you can also set the permission to where both teams can view each report.
- You can set up a dashboard for the different roles of your marketing team. For example, you might have a dashboard with only blogging metrics and another dashboard with only email campaign metrics. This allows each team to monitor their progress and see the metrics most relevant to them.
- You can create dashboards that provide a snapshot overview for members of your leadership team, providing them each with the high-level information relevant to the teams they manage.
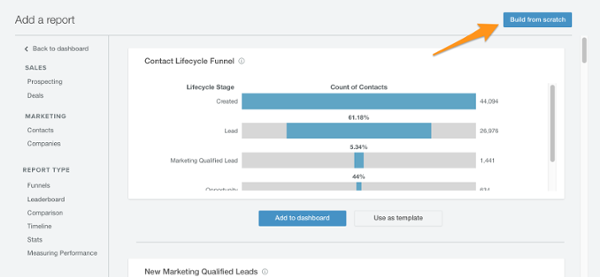
HubSpot Reports Templates
HubSpot provides several templates for you to use when generating your first reports.
When you click on the "Create new" button, you'll see a list of templates with your information already filled in that you can choose from.
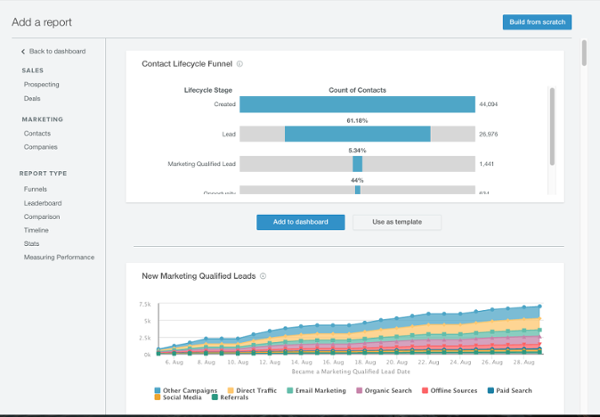
From there you can click "Add to dashboard" if you'd to add it as-is. To add or remove metrics and adjust the appearance of the report, click "Use as template."
After that, you'll be able to change the metrics that are measured, customize the display type, adjust the colors, and make other visual changes to your report.
Once you've got it setup just how you like it, click "Add to dashboard."
How to Create a Custom Report in HubSpot
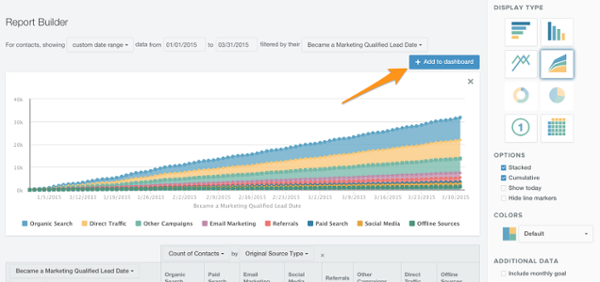
Once you've familiarized yourself with the templates you can venture into the custom reports by clicking "Create new" and then "Build from scratch."
This takes you to the Report Builder and opens up a large suite of options for you.
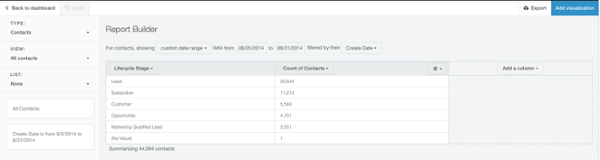
The first thing you'll need to decide is which type of report you want to build. Here are your options:
- Contacts
- Companies
- Deals
- Engagements
- Contacts Funnel
- Deals Funnel
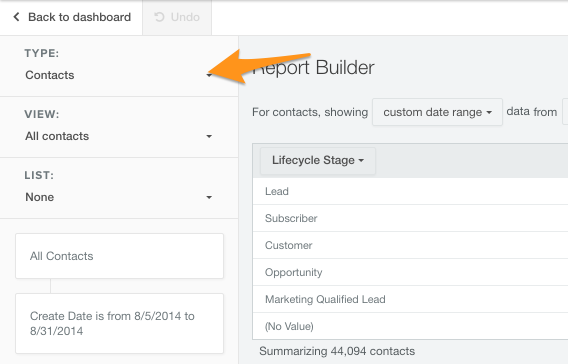
Then you can change the view to segment the contacts, for example, by location or another factor of your choosing. You can also narrow down your report type by list, such as contacts that have passed a particular amount of page views.
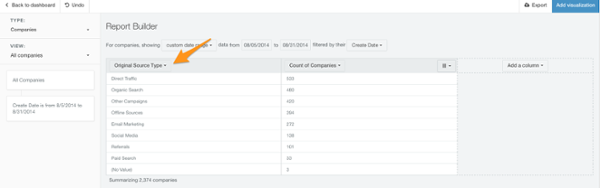
After that, you can select the first property for your report such as original source type, account type, company size, etc.
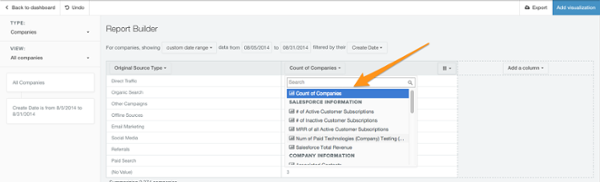
Next you will be able to select the variable that is measured. For example, if you had chosen original source type, you could select the count of companies, annual revenue, number of page views, etc.
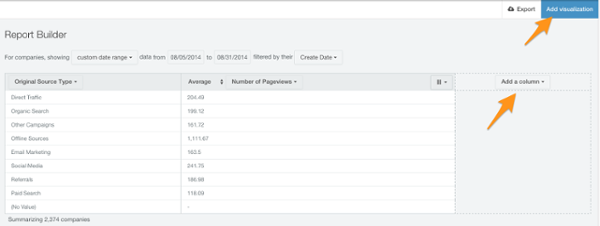
Once you've chosen the information that you want in your report, you can either add an additional column to include more data or you can go ahead and click "Add visualization" to edit the appearance.
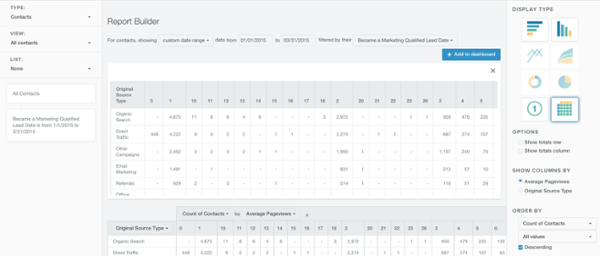
You will have several display types to choose from, depending on the information in your report. After tweaking your report to the way you like it, click "Add to dashboard" and you're all set.
Tips for Using HubSpot's Reports Dashboard
- Use the templates. I know, I know, you want to jump in and start creating ultra-customized reports. That's fine, but keep in mind that the templates are included for a reason -- they are the reports that HubSpot uses and feels are the most valuable for all businesses. Add all the creative reports you want, but don't neglect the templates.
- Create goals. If a metric is important enough for you to create a report around, it's important enough to improve on. Add goals to your reports to keep you on track and push your team accomplish more.
- Email reports to your teams. Speaking of pushing your teams, be sure to send them the reports to make sure they're actually viewing them. You can actually adjust a setting so that the reports are automatically sent to your teams at certain intervals.
- Add visualization. The different display types are there for a reason -- they make the presentation more effective and pleasing to the eyes. However, the visualization you use should be relevant to the information being presented. Here's a quick guide to understanding this feature.
- Resize and rearrange reports. Higher priority reports deserve more attention. You can adjust the size by moving your mouse over the bottom right corner and move reports around on your dashboard by clicking on the top left corner of the report.
- Create multiple dashboards. This helps you keep everything organized and minimizes the clutter. You can create dashboards for specific teams, specific people, or based on particular goals.
- Get specific. When I said that you should use the templates, I didn't mean you should avoid custom reports. With the report builder, you can use the view and list to create highly targeted reports. To increase the specificity even more, add a third dimension to your report.
To see a full rundown of the best practices suggested by HubSpot, take a look at this PDF.
Free Assessment:
/Assets/Icon%20Library/Arrows/Grey%20Arrow%20-%20Prev.svg)
/Assets/Icon%20Library/Arrows/Grey%20Arrow%20-%20Next.svg)