/Assets/base/Navigation%20Icons/TAYA.svg)
/Assets/base/Navigation%20Icons/Sales.svg)
/Assets/base/Navigation%20Icons/Web%20design.svg)
/Assets/base/Navigation%20Icons/HubSpot.svg)
/Assets/Icon%20Library/AI%20Mastery.svg)
/Assets/Icon%20Library/Learning%20Center%20Laptop.svg)

Sep 4, 2017
/Assets/Icon%20Library/x%20corp.svg)
/Assets/Icon%20Library/whatsapp%20logo.svg)
/Assets/Icon%20Library/Email.svg)

When you have it at your fingertips and can make informed decisions, data is a powerful thing. Without it, you’re not really being agile.
We’ve been wrestling with how to be more data-driven in our agile marketing approach for about a year now, as have been many agile marketers we’ve spoken to. Fortunately, we finally found the missing link - Databox.
What is Databox?
You might be asking yourself, what the heck is Databox? I found myself in the same boat a few months ago, so no worries if you don’t know about it yet.
Databox is a real-time data visualization tool that pulls data from multiple sources into one streamlined, extremely visually-appealing dashboard.
You don’t have to be a data nerd to know how to set it up, be a designer to figure out how to make your data easily understood, and you don’t have to pay an arm and a leg to finally have a report you and your executive team will actually look at.
One of the best parts is it’s led by a former HubSpotter, Pete Caputa, who really gets what inbound marketers and sales leaders want and need to see in order to make good decisions.
This is especially helpful for us because we get to play a hand in shaping the product and how it would best serve us and our clients.
Okay, one more “best thing” is it’s a mobile-first design. This means you have your data at all times, in real-time, in your pocket. No more calling your agency or marketing team and asking for a manual update. It’s literally at your fingertips.
How IMPACT Uses Databox
Alright, I promise I’m not trying to sell you Databox, though we have become a partner recently. It’s just made a huge difference for us, and I hope by reading this article, you can experience the same benefits!
At IMPACT, we use Databox in a few ways. Naturally, the first is rolling out a simple dashboard to all our clients.
Prior to the Databox swap, our team was manually pulling data from multiple sources and adding them to a Google sheet. This wasn’t that bad, in that it took about an hour of their time, BUT think of what we could have done in that hour that would have been more meaningful…like actually analyze that data.
We’ve always done that, of course, but it was not a very efficient process, and our clients (and team) would naturally prefer our time be spent on insights versus manual data entry.
If you’re leading a team and have members whose job involves gathering data, you will do yourself a huge favor by automating this task with Databox. Capitalize on your talent’s brains, not their fingertips.
So how did we determine what metrics to pull into our simple dashboard? To answer that question, let’s quickly revisit the Value Journey Canvas.
The Value Journey Canvas breaks down the buyer’s journey into 8 distinct stages that a prospect goes through as they become aware of your brand, eventually becoming an active advocate of your brand.
The 8 stages of the Value Journey Canvas are:
- Aware - A prospect has some kind of trigger that prompts them to find you or become “aware” of your brand.
- Engagement - Now this prospect is beginning to engage with you through your content; perhaps by reading a blog or watching one of your Facebook Live videos.
- Subscribe - The prospect has decided your content resonates and would like more from you. This could be in the form of a blog subscribe or content download.
- Convert - The prospect is making a commitment of time (i.e. watching a webinar or engaging in a free consulting session) or a small commitment of money (i.e. $7 report).
- Excite - This is the bridge between downloading an offer to becoming a customer. This is a great stage for sales enablement.
- Ascend - A prospect has seen value in your content and they are excited to work with you. In addition to your core offer, this is the time to offer additional product and/or service add-ons to ensure they get the most value from them.
- Advocate - Now that your prospect is a happy customer, they speak highly of your brand.
- Promote - This is when an extremely happy customer will actively and willingly promote your brand without your additional nurturing.
With Databox, we are able to track these stages by aligning them with the Inbound Methodology.
To do this, we built one dashboard of 3 databoards (one for each beginning stage of the Inbound Methodology: attract, close, and convert) that users can carousel between. Think of a “databoard” as a tab of a spreadsheet, only much prettier and easier to absorb.
Within each of those databoards, we track and monitor metrics corresponding to the Value Journey Canvas to better pinpoint where our clients have room for improvement.
Tracking the Value Journey Canvas on IMPACT’s Marketing and Sales Databox Dashboard
Here’s a breakdown of the dashboard we use.
Attract
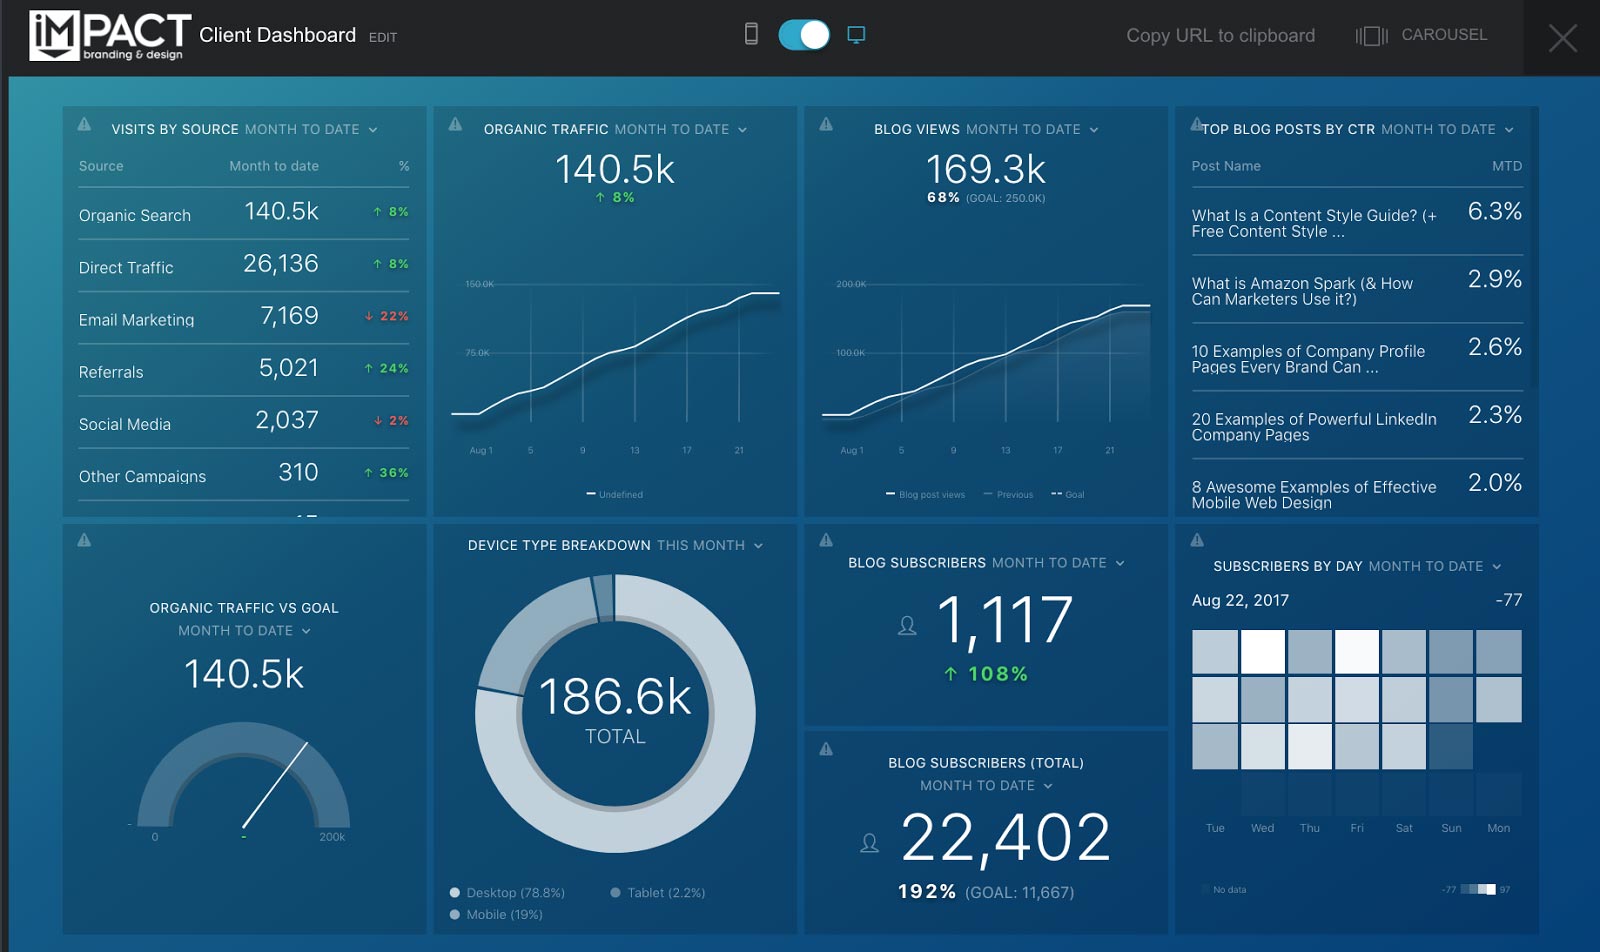
The Attract databoard tracks the following metrics:
- Visits by source
- Organic traffic
- Organic traffic vs. goal
- Device type by breakdown
- Blog views
- Blog subscribers month-to-date
- Blog subscribers total
- Blog subscribers by day
- Top blog posts by CTR
In this databoard, we get a full picture of how we’re doing in the aware and engage stages of the Value Journey Canvas. We can easily see how we’re doing against our goals and make adjustments in real-time to get back on track if we notice we’re behind.
What’s even better is this pulls from both HubSpot and Google Analytics, giving us seamless integration of data (and way less clicking around to see how we’re doing).
(Pssst! You can get this template for free!)
Convert
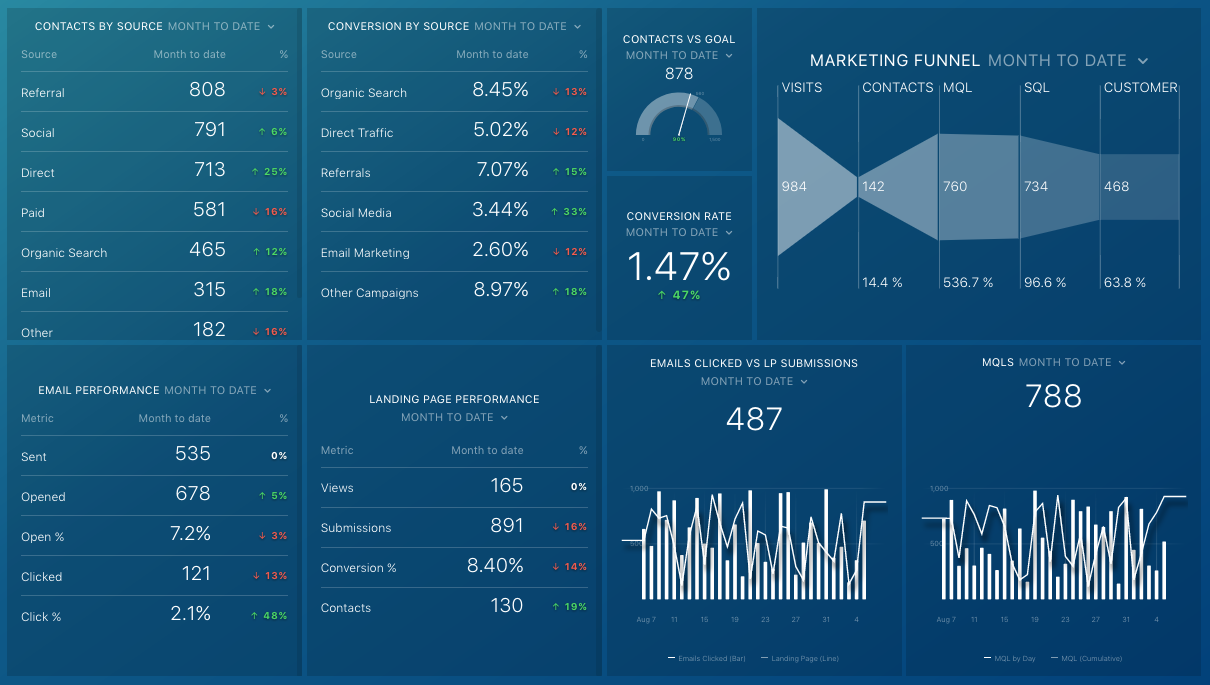
The Convert databoard tracks the following metrics:
- The full marketing funnel
- Contacts by source
- Conversions by sources
- Contacts vs. goal
- Conversion rate
- MQLs
- Email performance
- Landing page performance
- Emails clicked vs. landing page submissions
The Convert databoard helps us see how we’re doing in the subscribe and convert stages of the Value Journey Canvas. As we launch campaigns, we can better monitor their performance with these key data points, versus waiting until the end of the month to see if our plans worked out.
Download the template to with a free Databox account.
Close
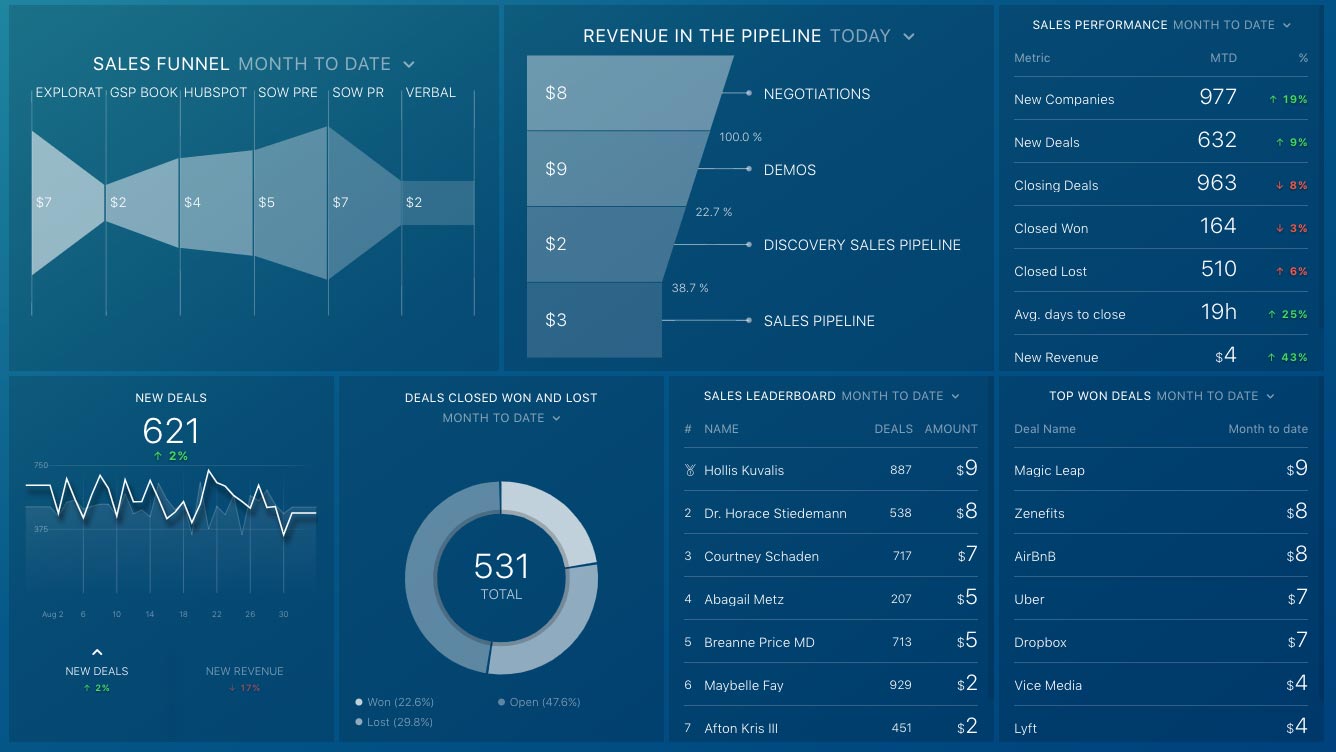
The Convert databoard tracks the following metrics:
- The full sales funnel
- New deals
- Deals closed won and lost
- Revenue in the pipeline
- Sales leaderboard
- Sales performance
- Top won deals
The Close databoard lets us see how the ascend stage is working out. This is also imperative for marketing and sales alignment. When we create service level agreements (SLAs) for our clients, this databoard helps both teams stay on track and figure out where the holes are if numbers are off.
Get this template with a free Databox account.
Since most of our clients come to us for help in the first three stages of the inbound methodology, we do not have a standard databoard for delight, which corresponds to advocate and promote in the Value Journey Canvas. If you have a referral program or customer success program, I’d highly recommend adding another databoard with those metrics.
Be More Agile with a Free Databox Account
So why should you care about all this?
First of all, imagine if you had to pull all of those metrics manually; It would be a killer! Our old scorecards were not nearly as detailed, but now we can easily pull the data our clients need -- AND we don’t have to wait until the end of the month to do so.
Second of all, this dashboard can be live streamed all day in a browser or a TV on your wall, which is pretty neat when you launch a campaign and want to know how it’s going (if you’re impatient like me).
Now, this is just scratching the surface.
We use this dashboard as a way to highlight red flags and better direct our attention to the metrics that matter. If we need to dig in, we’ll do so.
We are also making more custom dashboards to track key quarterly objectives our clients have outside of our standard dashboard (although there aren’t many more).
If you’re using Databox, I’d love to hear how it’s going for you and how you’re using it. If you want to use our dashboard template, while you’re at it, go right on ahead! You can get them for free in Databox’s template library.
Free Assessment:
/Assets/Icon%20Library/Arrows/Grey%20Arrow%20-%20Prev.svg)
/Assets/Icon%20Library/Arrows/Grey%20Arrow%20-%20Next.svg)