/Assets/base/Navigation%20Icons/TAYA.svg)
/Assets/base/Navigation%20Icons/Sales.svg)
/Assets/base/Navigation%20Icons/Web%20design.svg)
/Assets/base/Navigation%20Icons/HubSpot.svg)
/Assets/Icon%20Library/AI%20Mastery.svg)
/Assets/Icon%20Library/Learning%20Center%20Laptop.svg)

Apr 21, 2017
/Assets/Icon%20Library/x%20corp.svg)
/Assets/Icon%20Library/whatsapp%20logo.svg)
/Assets/Icon%20Library/Email.svg)

In digital marketing, knowing the right metrics is a necessity to continuously improve your strategies.
Because consumer behavior is always evolving, it’s vital to study all the reporting available so you can be sure your efforts are paying off.
To help provide marketers with the information they need, HubSpot recently released a new “Web Analytics” dashboard, complete with new reports with more in-depth metrics.
This new dashboard brings a range of analytics that hasn't yet been trackable in the current CRM, such as time on site, new vs. returning visitors, bounce rate, device type (mobile vs. desktop), sessions by country, and more.
But what do some of this terms mean, and how do you analyze this data and understand what it means for your website and its performance?
In this article, we're going to answer each of these questions by investigating each new metric, what they’re measuring, and how you can use this information to improve your marketing and website strategies.
Sessions
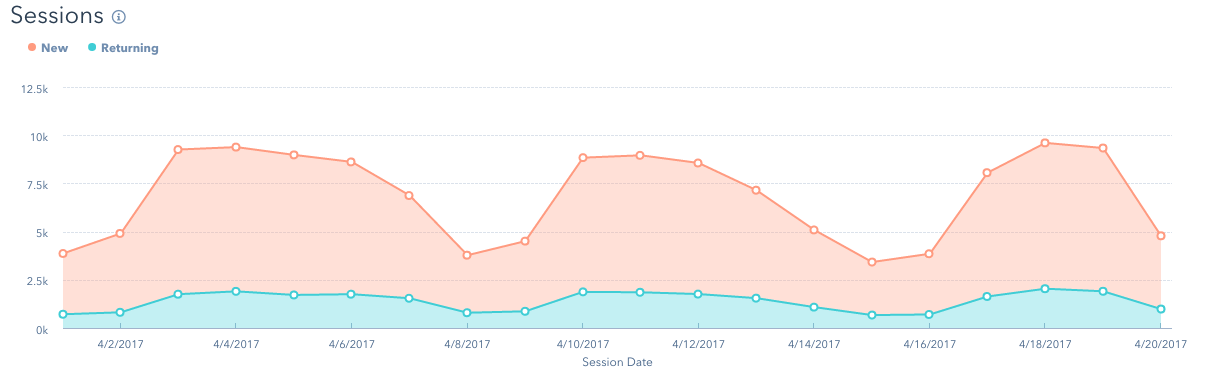
The sessions tool breaks down all engagements occurring on your website in a specified timeframe. Rather than “visits”, sessions measure different kinds of engagements, including CTA clicks and other events, and stops after 30 minutes of inactivity. This gives a more accurate representation of user activity so you can better understand the different ways users are engaging with your website and in what ways.
This report also divides sessions up into “new” and “recurring” sessions. Knowing this information provides marketers insight into both how well they’re attracting new visitors and keeping existing visitors coming back to the site. Both of these are valuable to help assess how well your website is working to push leads down the funnel.
Sessions by Source

Similar to the “Sources” report in the HubSpot reporting tool, this metric breaks down all sessions in a specified timeframe into the original source of the traffic. This allows you to measure which areas you're most successful in, and which sources are lacking in bringing in traffic.
If you notice specific channels you're attempting to invest in are performing lower than expected, you can pivot your current strategies appropriately so that it's more effective in raising the number of sessions from those particular sources.
New Visitor Sessions by Source
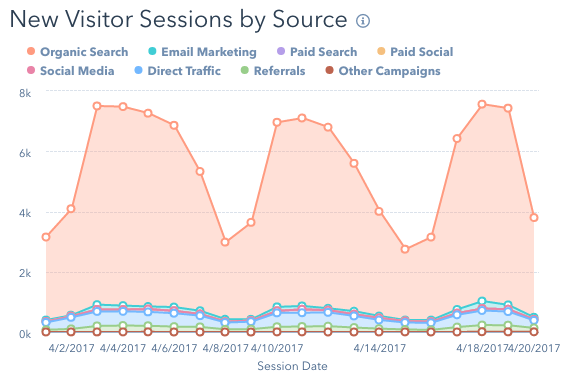
Although this is similar to the measure above, this report provides insight into a vital piece of information: how are people actually finding your website?
It’s great to know where your traffic is coming from in general, but this report measures how successful you are at pulling in traffic from an audience that is likely unfamiliar with your brand.
Knowing this information makes it easy to see where exactly you need to adapt your marketing strategy to bring new visitors in. For example, if you’re low in organic traffic for new visitors, this is an indicator that you might want to update your SEO strategy for more general terms that people unfamiliar with your company might search for.
You can also compare this report to the report above and see how successful you are with getting people to return to your website overall.
For example, if social media traffic is high for new sessions, but not for returning, it might indicate that your audience isn’t engaging with your social media content throughout the consideration and decision stage.
Bounce Rate
So you’re successfully attracting traffic to your website - but how well are you actually engaging users once they’re here?
HubSpot’s web analytics dashboard offers 3 comprehensive reports to help you answer that question.
The first, and arguably one of the most important, is the bounce rate report. Your website’s bounce rate refers to the sessions where someone comes to your website, views only one page, and then leaves. It is divided by your total number of sessions so you can see the exact percentage of sessions where this occurs.
This is a valuable metric to gauge the user experience on your website. A low bounce rate could mean you need to include more ways for users to get to the next step you want them to (i.e. through CTAs, internal linking, user-friendly navigation).
Pages per Session
The Pages Per Session report helps provide more visibility into how an average user interacts with your website.
While the bounce rate is telling of the percentage of people that only visit one page, this metric represents all sessions for your specified time frame. For example, a low bounce rate looks good alone, but if you're at 2 pages per session, then it still points to an issue in the user experience.
Like the bounce rate, marketers can utilize this metric to determine if they need to make website edits that will improve the user experience and make it easy to guide your audience to where you want them to land.
Additionally, this report can also be signal if you’re targeting the wrong audience. If you’ve determined your website is easy to navigate but this metric is still low, it could mean that the people you are attracting aren’t the right target for your brand.
Average Time on Site
The last key engagement metric in this dashboard is the average time on site per session.
When used with the two metrics above, this report can signal some key flaws in your website design and marketing strategy.
For example, if the average time on your site is low, this could mean that you’re targeting the wrong audience, or, visitors aren't finding, understanding, or being enticed by your website.
Conversely, if the average time on your site is high and pages per session are low, that would mean that your target user did find the information engaging, but left the website because there wasn’t a clear next step for them to follow. From this information, marketers could determine they needed to add more CTAs, links, and other “next step” options within website pages.
Session Engagement Rates by Source

Session engagement rates by source provide the three engagement metrics mentioned above broken down by traffic sources. This is done so marketers can better understand what sources are most successful with not only bringing users in, but keeping them on the site as well.
Device Breakdown
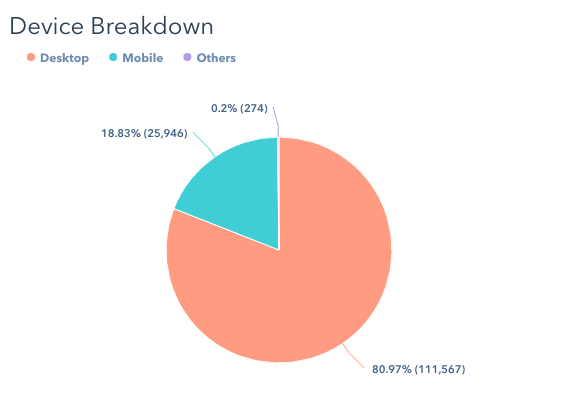
In order to ensure a good experience for all users on your site, you have to understand what devices they’re viewing your website on.
For example, if the majority of your sessions are coming from mobile, but those users aren't sticking around too long, then you know your mobile experience may not be set up to help users explore more of your website.
If you find mobile sessions are low, this might mean your website's mobile optimization might be lacking, causing Google to rank your site poorly and users to quickly leave your site due to UX issues.
This means it’s important to optimize your website for mobile to ensure you’re website is easy to navigate when on smaller devices.
Free Assessment:
/Assets/Icon%20Library/Arrows/Grey%20Arrow%20-%20Prev.svg)
/Assets/Icon%20Library/Arrows/Grey%20Arrow%20-%20Next.svg)