/Assets/base/Navigation%20Icons/TAYA.svg)
/Assets/base/Navigation%20Icons/Sales.svg)
/Assets/base/Navigation%20Icons/Web%20design.svg)
/Assets/base/Navigation%20Icons/HubSpot.svg)
/Assets/Icon%20Library/AI%20Mastery.svg)
/Assets/Icon%20Library/Learning%20Center%20Laptop.svg)

Sep 9, 2016
/Assets/Icon%20Library/x%20corp.svg)
/Assets/Icon%20Library/whatsapp%20logo.svg)
/Assets/Icon%20Library/Email.svg)

IMPACT has been using the HubSpot Reporting Tool for some time now and, let me tell you, we love it.
Leveraging it, we’ve developed more tailored reporting for our top of the funnel marketing, business development, and sales pipelines. We’ve also moved more things from spreadsheets into HubSpot Marketing, which honestly, has too many positive implications to list.
On top of that, we’ve used HubSpot’s Reporting Tool to discover some unexpected, but critical trends in our marketing.
Below, I’ll share a few of those reports, what we’ve found, and why you need to build them for your marketing team as well.
Marketing Reporting with HubSpot
1. Understanding Email Opt-outs:
Average number of email touches by source for Opted-out Leads
Let’s start by looking at the average number of emails sent to contacts that opted-out of our email list. Now, this number doesn’t say much without something to compare it to, right?
If we were to slice that data by lead source, we could learn quite a bit about what channels drive the most engaged users, which attract people who are quickest to jump ship, and understand how our overall average opt-out is divided by contact source.

Notice above that paid search is our quickest channel to jump ship, while “Other Campaigns” and “Social Media” are our strongest retainers.
Using this information, we know we have room to improve in our segmentation of contacts that come in via paid search so that we can send them better, more relevant emails.
2. Understanding Website Traffic:
All time Blog Views vs Landing Page Views vs Website Interior Pages
It’s pretty common to look at overall site traffic as a metric to judge marketing performance, but, that’s often a pretty wide generalization of how people are interacting with your organization.
By comparing Blog, Landing Page, and Website Interior traffic, you can get an idea of how your traffic is distributed and how one affects another.
Here are a few things we’ve noticed by segmenting our traffic by destination, for example:
- Large changes in blog traffic drive small changes in landing page traffic and even smaller changes in interior site traffic.
- We drive the most traffic to our interior site pages when we change our navigation bar or run specific campaigns. This effect slowly wears off over time showing us that our site needs to be constantly evolving in order to keep people’s attention.
- Months with high interior page traffic correlate with the months we do the most new business. Months with spikes in blog traffic correlate with the months we do the least new business.
- People don’t read marketing blogs between December 25th and January 1st. (If only this got people on Santa’s naughty list.)
3. Understanding Contact Location:
Contacts by IP State/Region
If your business serves a specific region, then understanding how your marketing efforts attract people from those regions is critical.
By sorting contacts by their state or region in HubSpot Reporting, you can determine what percentage of the people you are reaching are actually serviceable (and qualified).
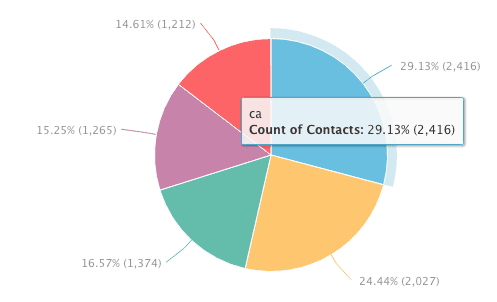
Above, you’re looking the contact distribution of IMPACT’s five most contact populated states in the USA. (We love you too, California!)
There are a few questions to ask here:
If you serve multiple areas, are you as successful attracting an audience from one as you are another? Is there an area that you’re attracting potential customers from that you could service, but don’t? Should you be focusing more on attracting people in your specific service area in general?
Business Development Reporting with HubSpot
4. Understanding Who You Should Buy Dinner
Customers Closed by First Referring Site
When a soon to be contact first visits your website, HubSpot takes note of where they come.
If the source of their visit happens to be a referral (meaning another site sent the contact to yours), HubSpot also takes note of who that referring site was.
Create a report of all the contacts you’ve marked in your database and then sort the one’s that have a referral source by the referral source.
You may find out you owe someone dinner… we sure did.
Here’s the story: If you were to Google “best inbound marketing agency,” the top ranking result is an extremely detailed article from The Sales Lion team, who are a fixture in the inbound community. Well, IMPACT happens to be ranked as number one in that article and needless to say, it’s helped us get introduced to a more than a handful of great customers.
If you take a look at our Customers Closed by First Referring Site report, it’s clear as day that The Sales Lion’s article can be directly attributed to referring those accounts.
Thanks Lion’s Den!
5. Understanding What Articles Attracted Sales Qualified Leads
Customers Closed by First Conversion
Different articles and calls-to-actions are aimed at different parts of the funnel, and some do an incredible job of attracting people are a great fit for your business right off the bat.
Sure, you can look at the report of each individual landing page and see which converted the most customers, but that’s not exactly scaleable.
Instead, I recommend creating a report of all of the business you’ve closed by first conversion.
If you find a certain offer or article is driving an above average amount of business, create a smart list of contacts who convert on it and then create an email campaign for members of that list!
If the people on this list haven’t become customers yet, the data shows they just might with the right push.
6. Understanding Which Traffic Source Drives Business & Revenue
Customers Closed by Source & Average Total Revenue
Knowing which of your traffic sources drive the type of traffic that does business with you is crucial to understand where to align your marketing resources, how to better craft emails, and much more.
This is important because every channel drives very different engagements.
Using IMPACT as a use case, Organic Search Source contacts have, on average, deals valuing double that of Social Media driven contacts.
Knowing this allows us to make decisions regarding sales outreach and marketing prioritization. It’s also something that we take into account when building out our complex lead scoring algorithm.
Sales Reporting in HubSpot (Requires HubSpot CRM Usage)
7. Understanding Sales Seasonality & Its Effect on Close Rate
Close Won vs Closed Lost by Amount over Time
Often times, businesses focus on metrics like the amount of new business revenue on a month-over-month or quarter-over-quarter basis and the organization’s close rate.
Using the HubSpot Reporting tool, we can combine the two.
This allows us to not only understand how seasonality and organizational changes affect revenue in a given time frame, but the factors that drive that.
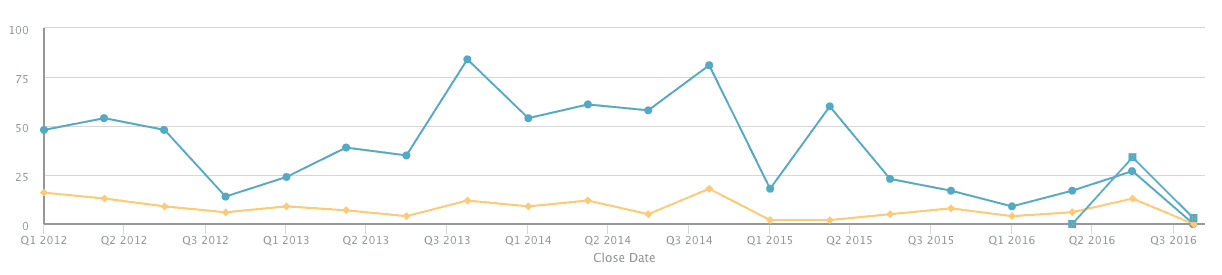
Knowing, for example, that when a sales team hits a certain number of deals in the pipeline, their conversion rate drops, is crucial in understanding how to scale your sales team. If you’re consistently hitting that point, congratulations! Now, go out and hire another sales rep.
Or, for another example, if you know that January is historically the busiest month of the year, you could recommend that your sales team takes time off before the holidays as opposed to after it.
Using HubSpot Reporting
Like any data set, the more information it contains, the more difficult it becomes to understand.
HubSpot Marketing is, like many tools in today’s age, a stellar data collector and luckily, HubSpot’s Reporting tool gives you the functions you need to turn all of that data into a deeper understanding of your marketing and sales performance.
Now, I’m going to gather that a good portion of you are looking at this article saying, “I want that report, but I have no clue how to generate it.” Well, I’ve developed all of these reports for IMPACT and I’d be happy to do two things:
- Walk you through creating one of these reports.
- Teach you how to create reports on your own, so that you can make the rest!
Best of all, I’d be happy to do it at no cost to you.
Free Assessment:
/Assets/Icon%20Library/Arrows/Grey%20Arrow%20-%20Prev.svg)
/Assets/Icon%20Library/Arrows/Grey%20Arrow%20-%20Next.svg)